![[2024-11-13_Projects While Completing Master’s of Science in Analytics at Georgia Tech-1.png]]
In late 2019, I was staffed on a project that involved implementing new forecasting algorithms for a large retailer. It was my first hands-on exposure to data science and I was immediately intrigued. While my role was on the functional-side as a Product Owner, it became clear to me how much value these data-driven algorithms have on the business landscape. Simply knowing the names of the algorithms was not enough. As with anything I find interesting, I needed to understand how ‘data science’ truly functioned and could be applied (in other words, I strived for [Richard Feynman’s definition of understanding](https://coffeeandjunk.com/knowing-something/)).
Thus, I began the search for a program where I could strengthen my understanding of data science and analytics. I needed to find a program that I could complete while working. It also needed to be affordable, but with strong name recognition to deem it a worthwhile investment. After careful consideration, I ended up attending Georgia Tech’s Online Master’s of Science in Analytics (OMSA) program.
During this program I worked on several impactful projects. This post will provide a deep-dive on those projects, along with a brief overview on the OMSA program and courses.
# The Online Master’s of Science in Analytics (OMSA) Program at GT
![[2024-11-13_Projects While Completing Master’s of Science in Analytics at Georgia Tech.png]]
While this post is not centered on the selection of my data science program I did want to provide a few key points related to the OMSA program. For a detailed review, I believe [this post](https://medium.com/@david_yoo/my-review-of-georgia-techs-online-of-master-of-science-in-analytics-omsa-816406316b82) does a great job.
- **Curriculum** – the program offers three ‘tracks’: Analytical Tools, Business Analytics, and Computational Data Analytics. My goal was to enhance my technical tool belt with the understanding of when / how to implement algorithms to help drive business value on my projects. The Computational Data Analytics track provided the perfect curriculum to understand these topics at the depth I desired.
- **Reputation** – at the end of any degree, you are left with the skills you learned and the diploma that gives other parties confidence in your skills. Both of these are crucial for getting the full benefit of your degree. Georgia Tech comes with a strong name recognition, especially in the realm of engineering. The OMSA program has a high acceptance rate, but that is balanced out by a low completion rate due to the difficulty of the program.
- **Cost** – one huge differentiator is the affordability of the GT OMSA program. The figures below are outdated, but show a good reference point for the price differential.
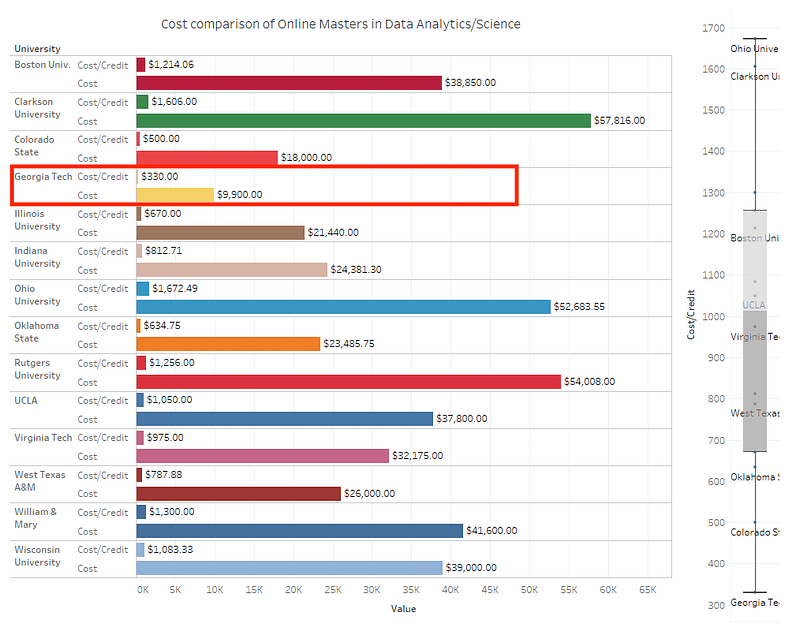
Source: [https://www.reddit.com/r/OMSA/comments/kz2t2v/cost_comparison_of_data_analytics_masters_degrees/](https://www.reddit.com/r/OMSA/comments/kz2t2v/cost_comparison_of_data_analytics_masters_degrees/)
## The Courses
There are countless great courses in the OMSA program. They also do a great job of constantly creating new courses to keep up with the ever evolving landscape of today’s world. To learn about the latest courses, check out the program’s website [here](https://pe.gatech.edu/degrees/analytics/curriculum). If you’re like me, and would prefer to hear from students who took the courses, refer to [OMSCentral.com](https://www.omscentral.com/).
The three courses where I completed my most impactful projects are as follows:
| | | |
| ---------------------------------------------------------------------------------------------------------------- | --------------- | ------------- |
| **Course Name** | **Difficulty*** | **Rating*** |
| [CSE 6250: Big Data for Health Informatics](https://omscs.gatech.edu/cse-6250-big-data-health-informatics) | 4.24 out of 5 | 3.77 out of 5 |
| [CSE 6242: Data and Visual Analytics](https://omscs.gatech.edu/cse-6242-data-and-visual-analytics) | 3.22 out of 5 | 2.91 out of 5 |
| [CSE 6748: Applied Analytics Practicum](https://www.analytics.gatech.edu/curriculum/applied-analytics-practicum) | 2.0 out of 5 | 3.78 out of 5 |
_*According to OMSCentral.com as of 07/23/2024
## The Projects
### Project #1 – Reproducing SimPer: Simple Self-Supervised Learning of Periodic Targets
#### School Objective
As part of CSE 6250 (Big Data for Health Informatics), we were asked to replicate a recent research paper related to health and data science. We selected a paper titled [“SimPer: Simple Self-Supervised Learning of Periodic Targets”](https://arxiv.org/abs/2210.03115).
#### Business Objective
In the paper “SimPer: Simple Self-Supervised Learning of Periodic Target” (Yang et al., 2023), the authors observed a gap in the existence of Self Supervised Learning (SSL) models that work well with periodic data (i.e., data that has a pattern over time). This gap was tested by using various State-of-the-Art (SOTA) SSL models on periodic data. Each failed to capture the underlying pattern. As such, the authors designed and implemented a new technique called SimPer (Simple SSL of Periodic Targets) and applied the approach to periodic data, such as heartbeat videos.
#### Technical Environment
The [original implementation](https://github.com/YyzHarry/SimPer) was completed using the TensorFlow package in Python. Our team’s implementation attempted to replicate the results using the PyTorch package.
#### Data Source(s)
The data used is the MNIST RotatingDigits dataset, which is included in the TensorFlow dataset package described here: [https://www.tensorflow.org/datasets/catalog/mnist](https://www.tensorflow.org/datasets/catalog/mnist). The data is then transformed to turn it into periodic rotating digits to be used in SimPer. The data is further transformed to create periodicity-variant and periodicity-invariant samples, which are described in the approach below.
Below are a few metrics on the dataset:
- Total Data Size: 12.2GB
- Train Set Samples: 10,000
- Test Set Samples: 100
The distribution of labels is not essential, so for this experiment, we applied random sampling from the MNIST dataset with a uniform distribution across 0 through 9.
#### Approach
The SimPer paper uses different network architectures depending on the dataset. For the MNIST RotatingDigits data covered in this reproduction, the paper uses a 3D Convolutional Neural Network (CNN). This model is a 3-dimensional CNN. The reason for using 3 dimensions is that, in addition to the dimensions of a 2D image, there is an additional dimension for the sequence of rotations, making it 3D.
The SimPer framework has various components. Each was carefully selected by the original authors to produce an SSL approach that performs well with periodic data. There are three primary innovations applied by the authors:
1. _Temporal Self-Contrastive Learning_ – This innovation is around the pre-processing needed to prepare periodic data for the models. To do so, two different views are created of the data, which are described below. There are various benefits from this approach. One benefit is it allows for creating as large of a training dataset as needed. An infinite amount of periodicity-variant augmentations can be created for any range of frequencies. Additionally, the periodicity (i.e., patterns) in the data become further accentuated through the hard negative samples.
- Periodicity-Variant Augmentations: In this approach, a negative view of the data is created by changing the speed (i.e., frequency) of the periodic data (i.e., video). This was be achieved by randomly varying the rotation frequency
- Periodicity-Invariant Augmentations: In this approach, the speed stays the same, but various other changes are made on the data (i.e., data). These changes include cropping, resizing, reversing, or delaying to create additional views of the data. This was achieved by applying random crop, random Gaussian blur, random jitter, and random horizontal flip transformations to the images
2. _Periodic Feature Similarity_ – The paper argues that most feature similarity measures do not perform well in the context of periodic data. To address this issue, the paper leverages two periodic feature similarity metrics: Maximum Cross-correlation (MXCorr) and Normalized Power Spectrum Density (nPSD). MXCorr uses offsets between signals to determine a maximum similarity. This approach works well for periodic data, because the offsets (i.e., shifts) should still preserve the periodicity (i.e., patterns) in the data. Once again, the benefit of this similarity metric is it will be able to detect similarity in periodic data that is shifted, reversed, or changed in frequency.
3. _Generalized Contrastive Loss_ – The loss function was also specifically selected to work well with periodic data. SimPer uses a generalized version of InfoNCE contrastive loss (Oord et al., 2018). The original implementation of InfoNCE uses single target classification, but SimPer generalizes to a soft regression variant, where it is a weighted loss over all augmented pairs. This shifts the loss function to work better in continuity modeling that performs better for periodic data. This concept is proven in Appendix D.4.4 of the original paper.
#### Results Summary
The goal is to reproduce the paper’s SimPer method against a MNIST rotating digits dataset and compare the result with the original paper, along with the result of the other unsupervised SSLs that motivated the original paper.
The baseline goal of reproducing an implementation of SimPer using PyTorch, rather than the original paper’s TensorFlow approach, was successful. Our code is able to read in the large handwritten dataset, apply rotation on the data, pre-process through periodicity-invariant / periodicity-variant methods, calculate an MXCorr similarity measure, calculate the generalized InfoNCE loss function, and run the results through the 3D Convolution Neural Network (CNN).
In terms of results, the reproduced version of SimPer is not as successful as the original implementation, but it does perform better than other SSLs. To assess the results, a Uniform Manifold Approximation and Projection (UMAP) representation of the reproduced outputs was created to compare against the UMAP representation in the original paper.
UMAP is a non-linear dimension reduction algorithm. It allows for taking in the high-dimensional data produced by the SimPer approach and mapping it to the 2-dimensional space to be visualized. The below figures displays the various UMAP representations needed to compare the reproduced SimPer results with the original SimPer paper and other SSLs.
The UMAP representations help visualize the strengths of SimPer compared to other models. Figure 5 can be treated as the “ground truth” for comparison of what a “high performing” model would produce, since it is the results of a supervised model, which should naturally outperform the self-supervised models considered in the SimPer implementation.
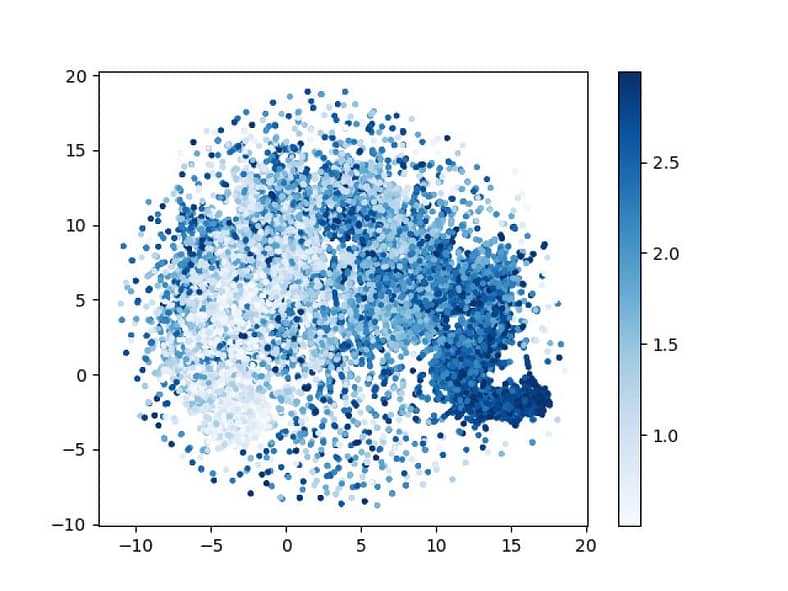
_Figure 1: Reproduced SimPer: UMAP of Representation Features Learned on RotatingDigits Dataset_

_Figure 2: Original SimPer on RotatingDigits_

_Figure 3: Self-supervised Learning Model: CVRL_

_Figure 4: Self-supervised Learning Model: SimCLR_
In Figure 2, it is evident that the original SimPer does a great job clustering the rotating digits based on the similar shape with Figure 5 and clustering of digits with similar frequencies.
Figures 3 and 4 are other self-supervised models that motivated the original authors to find a better approach for SSL on periodic data. The results of CVRL (Figure 3) are decent, but not as promising as SimPer. On the other hand, SimCLR (Figure 4) does a poor job to the point where the UMAP results look like a random scatter plot.
The performance of our reproduced SimPer in Figure 1 is somewhere in between that of SimCLR and the original SimPer. Thus, it can be implied the MAE is somewhere between the 2.96 achieved by SimCLR and 0.22 from SimPer.
The reproduced implementation does a decent job of capturing the periodicity across a majority of the dataset, but there are many points that seem to not be properly clustered. These results could be impacted by the implementation of our UMAP algorithm. For the two primary UMAP hyperparameters, we used values of number of neighbors equal to 5 and minimum distance equal to 0.3. Each of these could likely be tuned further to produce a result that more closely resembles the original paper.
### Project #2 – Commercial Vehicle Routing to Optimize for Needs of Small Businesses in NYC
#### School Objective
As part of CSE 6242 (Data Visualization and Analytics), we were asked to solved a business problem using a large amount of data and a visualization. The project was very open ended. My team ended up choosing to create a solution that small businesses could use for deliveries that provides optimal paths based on their preferred parameters.
#### Business Objective
The scarcity of space needed for efficient and safe commercial vehicle operation is evident in NYC. The Office of the Manhattan Borough President estimates that there is a multi-minute delay in traffic for each package delivered during morning peak hours. These delays impact individuals and businesses.
The widely available routing applications are tuned for individual use that optimizes for the fastest route between points. This approach is not sufficient for small businesses that rely on delivering orders to maximize their Return on Investment (ROI). There is research in solving this business problem. Marinakis explored using a new variant of Particle Swarm Optimization (PSO) algorithm to solve the Vehicle Routing Problem with Time Windows, but this only accounts for time windows and not other nuances that may impact ROI. Some research does optimize for other costs, such as Zhang in accounting for “green” factors like charging station location, but this would result in minimal benefits for businesses with small fleets.
Regardless, these types of approaches are likely only available in automated transportation management systems (TMS) that are very costly ([$10,000 – $250,000 per license subscription](https://mercurygate.com/blog-posts/tms-software-price-what-shippers-and-lsps-need-to-know/#:~:text=Generally%2C%20the%20cost%20is%20%241,associated%20with%20this%20TMS%20setup.)). Small businesses need a cost-efficient solution, which will construct efficient routes to improve their margins.
More precisely, our solution addressed the Vehicle Routing Problem (VRP) for small businesses. VRP is an optimization problem to determine the optimal set of routes for a fleet of vehicles to a set of customers. There are many variations of this problem. For our small business use case, we will model for a single depot with a small to medium size fleet completing drop offs to a set of customers. The solution will optimize for key factors that impact ROI, such as distance, time, and other costs (e.g., parking).
#### Technical Environment
Our solution was a web application developed in Python. We used the following frameworks and packages:
- [Django](https://www.djangoproject.com/) – _“high-level Python web framework that encourages rapid development and clean, pragmatic design. Built by experienced developers, it takes care of much of the hassle of web development, so you can focus on writing your app without needing to reinvent the wheel. It’s free and open source.”_
- [OSMnx](https://osmnx.readthedocs.io/en/stable/) – _“Python package to easily download, model, analyze, and visualize street networks and other geospatial features from OpenStreetMap. You can download and model walking, driving, or biking networks with a single line of code then analyze and visualize them. You can just as easily work with urban amenities/points of interest, building footprints, transit stops, elevation data, street orientations, speed/travel time, and routing”_
- [Networkx](https://networkx.org/) – _“Python package for the creation, manipulation, and study of the structure, dynamics, and functions of complex networks.”_
- [Google Maps API](https://developers.google.com/maps) – _“Create real-world, real-time experiences with the latest Maps, Routes, and Places features from Google Maps Platform. Built by the Google team for developers everywhere.”_
#### Data Source(s):
One key feature of our solution was integrating with NYC parking meter data to assist small businesses in avoiding costly tickets and time spent searching for parking meters. The source for this data is [NYC OpenData](https://data.cityofnewyork.us/Transportation/Parking-Meters-Locations-and-Status/693u-uax6).
#### Approach
We aim to solve the problem for small businesses that need a lower cost alternative to TMS apps. To do so, we used a familiar Google maps interface that requires minimal learning for employees, that leads to higher business ROI and zero onboarding friction, minimizing human error related to the use of software. The minimal viable product (MVP) will target the NYC market first, as it has a high density of commercial addresses coupled with a high volume of business transactions and deliveries.
Once a baseline is established, we innovated through three elements: low-cost software solution, highly calibrated Vehicle Routing Problem algorithms that account for ROI related parameters (delivery windows, travel time, commercial routes, parking/ tolls, etc.), and a user-friendly zero learning curve interface built on top of Google maps.
#### Results Summary
In conclusion, the team produced an application that contained all of the minimally viable innovations needed to add value to small businesses making deliveries in NYC. Although, there were some limitations, including:
- Lack of processing capacity needed to efficiently run optimization models across large areas, as such, most of our testing was limited to the Manhattan borough
- Lack of time to implement some advanced features, including a hybrid optimization model that can weigh time and distance optimization
Despite these limitations, the application can:
- Use user inputs, the Google Maps API and backend data to optimize a VRP for time or distance
- Provide the user a visual feedback mechanism for viewing and comparing proposed routes
- Provide the user a parking violation heatmap as an additional visual aid in selecting the ideal route


In the future, the team would like to further enhance the application by:
- Expand to further offer innovative parking related information, such as estimated waiting time for parking and time spent parked
- Tune additional route optimization models that perform better based on expectations of optimizing for distance vs. time
- Expand to markets outside of NYC to allow for broader support of local businesses
### Project #3 – Transaction Forecasting for New Customers of POS System
#### School Objective
My final project was part of the capstone course, CSE 6748 Applied Analytics Practicum. We were assigned a real company and a project they were interested in. Non-disclose Agreements (NDAs) were signed, so I cannot disclose information related to this project.
In terms of experience, though, there was a lot of value. We were exposed to a real business problem and got to use real data to try to solve it. It helped show the difference between academic work with a “right” answer and the real world where there is much more ambiguity.
## Retrospective
Each of these projects made me a stronger professional. They provided diversity and depth that is difficult to get when working in a single industry or company. Without joining the OMSA program, I would not have the opportunity to learn any of these areas, which further validates that I made the right decision in completing this program.
Lastly, I am thankful for the strong teammates I had along the way. Each person taught me something new.
I plan to continue to implement interesting projects, such as these, in my free time. There is always something new to learn and each day is an opportunity to get better.
#### Tags
#blog-post #professional-development